This tutorial was rendered using Rdistance version 4.5.0.
Abundance via line-transect distance-sampling when detection depends on covariates.
Loading required package: units
udunits database from C:/Users/trent/AppData/Local/R/win-library/4.6/units/share/udunits/udunits2.xml
data(sparrowDf)

oneHectare <- units::set_units(1, "ha")
whi <- set_units(200, "m")

dfuncFit <- sparrowDf |>
  dfuncEstim(dist ~ bare + groupsize(groupsize)
             , likelihood = "hazrate"
             , w.hi = whi) |>
  abundEstim(area = oneHectare
             , ci = NULL)

summary(dfuncFit)
Call: dfuncEstim(data = sparrowDf, dist ~ bare + groupsize(groupsize),
   likelihood = "hazrate", w.hi = whi)
Coefficients:
             Estimate    SE           z          p(>|z|)
(Intercept)  3.22867307  0.230688774  13.995796  1.653672e-44
bare         0.01214628  0.003512742   3.457778  5.446505e-04
k            3.15551173  0.411046996   7.676766  1.631547e-14

Message: Success; Asymptotic SE's
Function: HAZRATE
Strip: 0 [m] to 200 [m]
Average effective strip width (ESW): 66.26362 [m] (range 48.15407 [m] to 86.61745 [m])
Average probability of detection: 0.3313181 (range 0.2407703 to 0.4330873)
Scaling: g(0 [m]) = 1
Log likelihood: -1641.974
AICc: 3290.016

     Surveyed Units: 36000 [m]
   Individuals seen: 372 in 354 groups
 Average group size: 1.050847
   Group size range: 1 to 3
Density in sampled area: 8.023898e-05 [1/m^2]
Abundance in 10000 [m^2] study area: 0.8023898
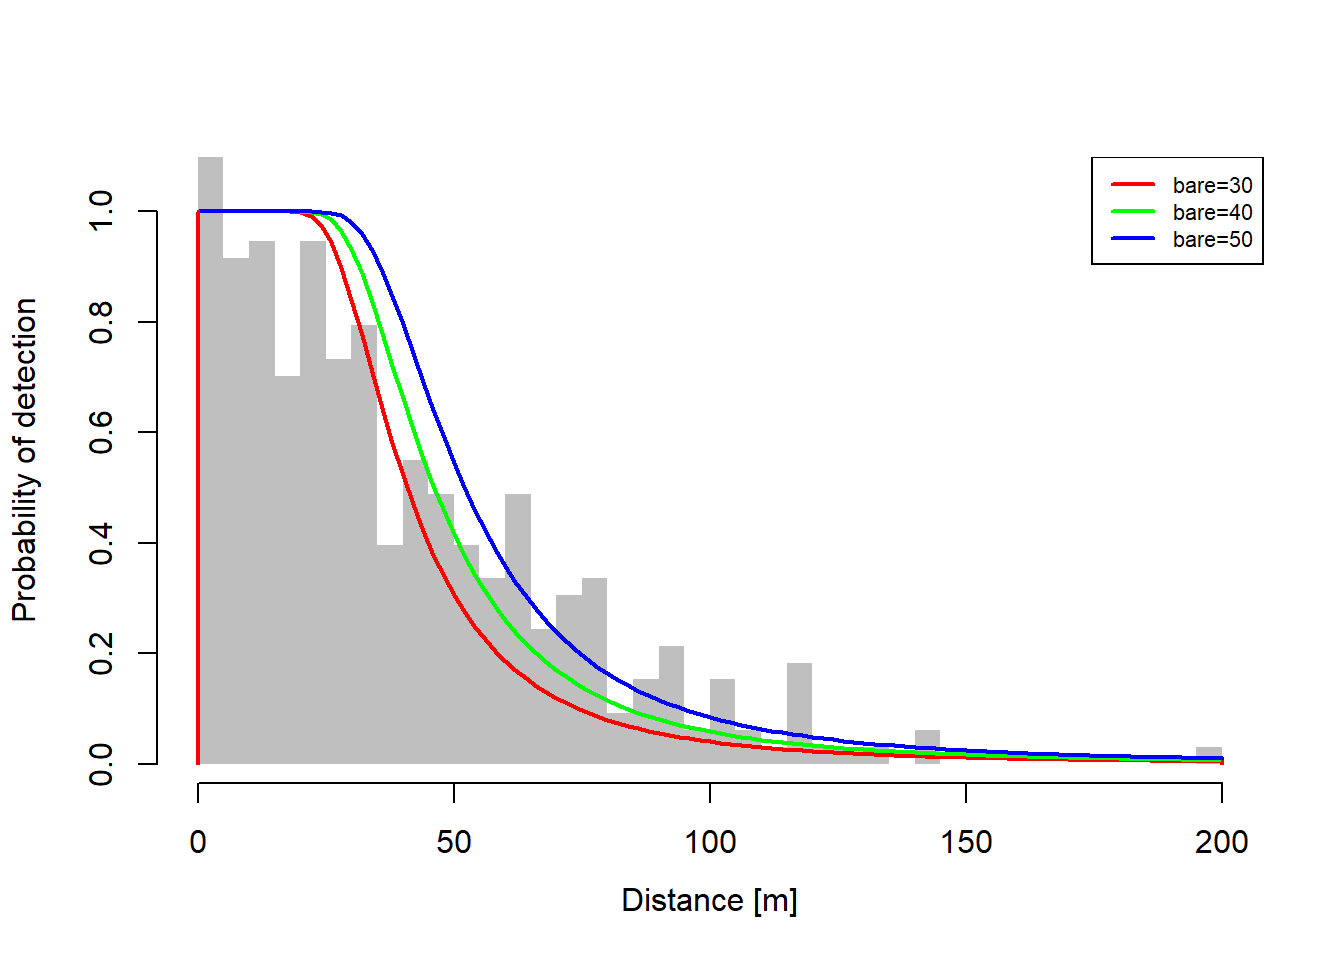
plot(dfuncFit
     , newdata = data.frame(bare = c(30, 40, 50))
     , lty = 1
     , nbins = 30
     , border = NA
     , col = "grey75")